
Article: Using Dedoose in Your Presentation
Tags
- All
- Training (4)
- Account Management and Security (9)
- Features of Dedoose (9)
- Dedoose Desktop App (1)
- Dedoose Upgrades and Updates (5)
- Dedoose News (6)
- Qualitative Methods and Data (11)
- Other (5)
- Media (5)
- Filtering (5)
- Descriptors (10)
- Analysis (22)
- Data Preparation and Management (20)
- Quantitative Methods and Data (5)
- Mixed Methods (20)
- Inter Rater Reliability (3)
- Codes (26)
- Tags:
- Other
Using Dedoose in Your Presentation
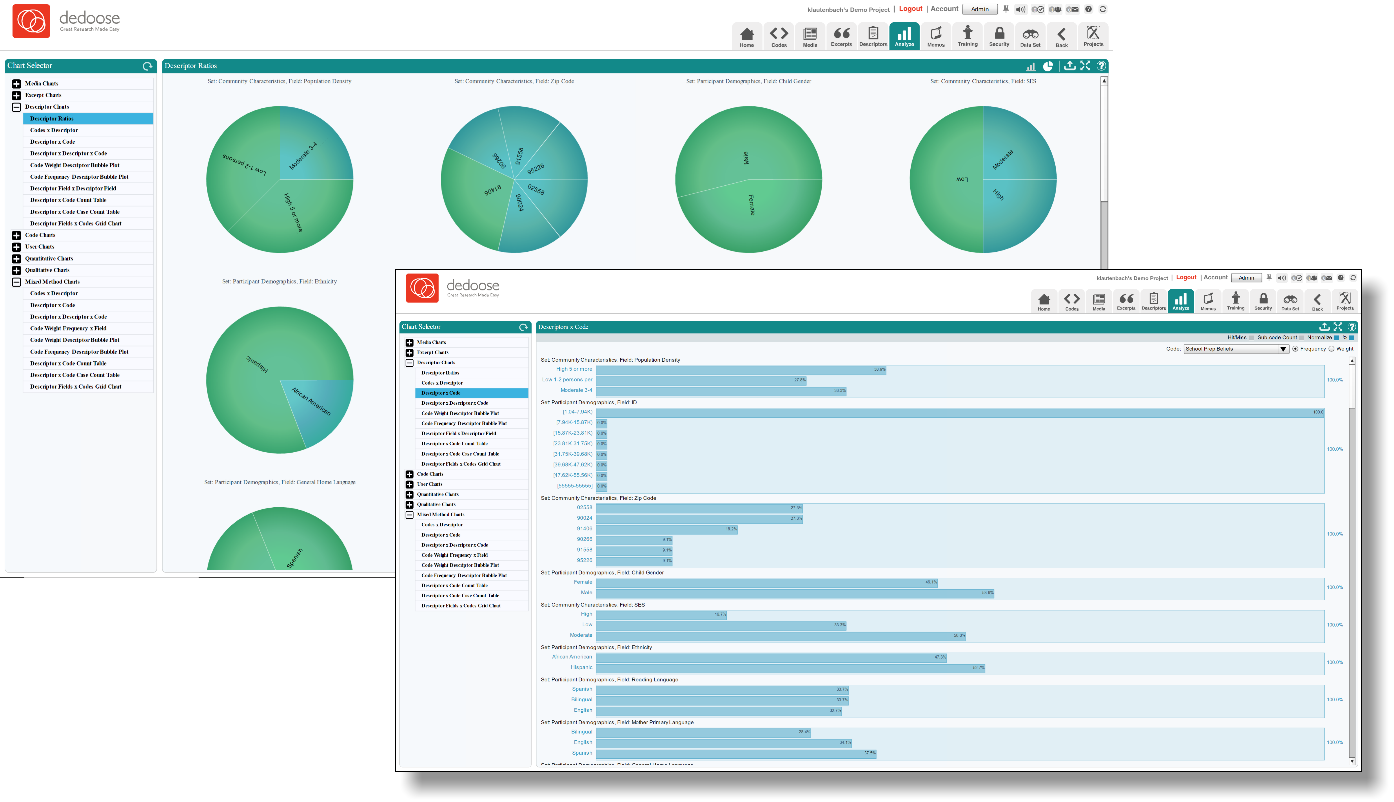
We often spend so much time concentrating on explaining the functions and features of Dedoose that we forget the end goal of most research projects: drafting a report and presenting your findings. Thankfully, Dedoose makes it fairly easy to pull data, charts, graphs and excerpts from your project to insert them into a presentation or document.
We have several exports that can help with this task, you can find a summary of them in a previous blog linked here. For this blog, however, we’ll be going over the exports you can receive of the charts and graphs, as well as specific excerpts. In most cases an export of any given chart will give you an Excel spreadsheet containing the corresponding data with the Excel version of the same chart. “But what if I like the way the chart looks in Dedoose?”, I can hear you saying. Fear not Dedooser, this is what screenshots were made for. For our users on Windows computers, Snipping Tool is a default program installed on your computer, try typing it into your Start Menu search bar. For our Mac users, use the following steps to accomplish this as well.

- Press “Shift”, “Command”, and “5” at the same time
- Click the outline button in the onscreen control panel that appears
- Drag to select an area of the screen to capture. To move the entire selection, drag from within the selection
- Click Capture in the onscreen controls
- Use the thumbnail to markup, share, save, or take other actions
Using these tools, we can capture the portions of the display we want and leave out the rest.
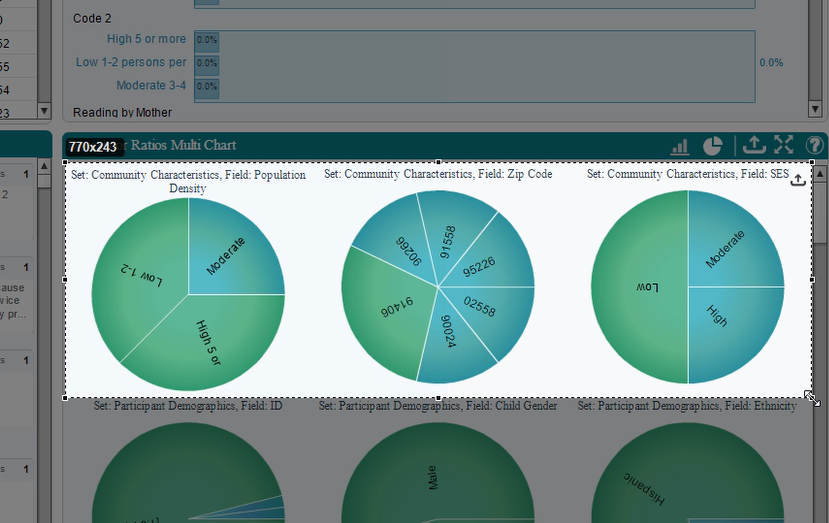
That being said, some charts are presentation ready on export to PDF like the Descriptor Ratios Multi Chart. This chart displays the ratio of the groups within your descriptors; how many men vs women are involved in the study? How many participants are from a specific region? If you collected these data and properly set them up in the Descriptors tab, this chart will give you a visual of exactly that.
This is a good point to mention the excerpts behind any charts are easily accessible right from the chart. Every chart or graph in Dedoose is composed of “hot links” to the data behind them. Click on any portion of a chart or graph and you will be taken to the excerpts associated with the object or range you clicked in your chart or graph. From here you can easily export the associated excerpts to Excel or Word for further review or inclusion in a report. For users that have read over some of our other blogs on coding practices, you may be familiar with the ‘Great Quotes’ code we often advocate. This is almost precisely the reason, having a collection of excerpts that are representative of the larger data set under one code makes for easy retrieval.
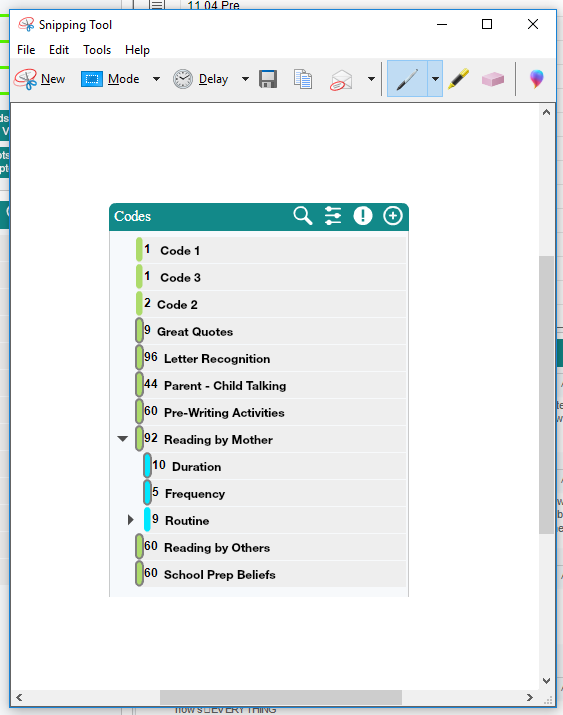
You may have use for exporting the code tree itself, the themes and ideas present in a project can often be easily expressed by the code tree. Adding to this either ‘Explicit Code Counts’ or ‘Child Sum Code Counts’ and you have a general idea of what themes are present in a project and a value of how present they are overall within the project. A quick screen grab can get you the tree as it is displayed in Dedoose, exporting the codes will give you an Excel spreadsheet containing the ancillary information about the codes; the description, if a given code is weighted and the range of values for that weight, as well as the position in the code tree. This may be important to include in a final report or presentation to better indicate your approach to coding the data and as an added bonus will likely make an easy segue into discussing the excerpts associated with the most prominent codes.
There are occasions you may want to include an inter-rater reliability score to demonstrate your agreement with the other researchers on your team. The quick and easy way to get this score is to create a test and have members of your team then take the training center test within Dedoose. Our User Guide can help get you started on doing so, check out the link here. Although there are times that isn’t adequate, a training center test is often built on a small portion of the data to keep the time it takes relatively short. We also have a past article that discusses how to get an IRR score across the project, although I hope you brought your math brains for this one. The link here will take you to the article, it is relatively heavy on the statistics so be warned. These scores aren’t always necessary, although if you wish to provide proof that everyone on a team has consistent approaches to coding there is no better way.
As the final piece of this blog, we’ll address documenting Dedoose use. We are occasionally asked how to cite Dedoose in reports, to do this you’ll want to cite Dedoose in the following format:
Dedoose Version ..*, web application for managing, analyzing, and presenting qualitative and mixed method research data (2019). Los Angeles, CA: SocioCultural Research Consultants, LLC www.dedoose.com.
The * should be replaced with the version number at the time of the drafting of the report. You can view which version of Dedoose you are using by inspecting the web address at the top of your browser when you are logged in.
That about does it for this blog, thanks for taking the time to read it. We’d love to know what you think, comments, suggestions and questions can all be sent to support@dedoose.com and our friendly support staff will do everything they can to help. We do build this application for you after all, anything you’d like to make us aware of or any features you think our application would benefit from are all things we’d love to hear about.